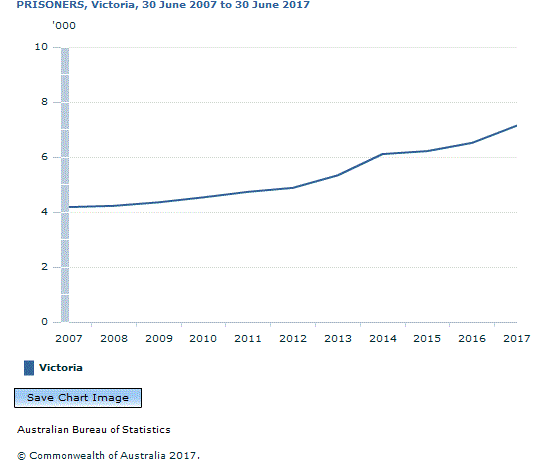
The number of prisoners in Victorian prisons was 7,149, an increase of 10% (627 prisoners) from 2016. (Table 15)
The adult imprisonment rate was 145 prisoners per 100,000 adult population, an increase from 138 in 2016. (Table 19)
Half (50% or 3,575 prisoners) of all prisoners had previously been imprisoned under sentence. (Table 14)
The most common offence/charge was Acts intended to cause injury (19% or 1,393 prisoners), followed by Illicit drug offences (14% or 1,033 prisoners) and Sexual assault (13% or 932 prisoners). (Table 16)
Sex
Males comprised 93% (6,644 prisoners) of the total prisoner population. (Table 14)
Since 30 June 2016, the male imprisonment rate increased from 264 to 276 prisoners per 100,000 male adult population, while the female rate increased from 18 to 20 prisoners per 100,000 female adult population. (Table 15)
Age
The median age of adult prisoners was 35 years of age. (Table 14)
Country of Birth
Overseas born prisoners accounted for 26% (1,847 prisoners) of the Victorian prisoner population. This was the largest proportion of overseas born prisoners of any state or territory.
The largest proportion of overseas born prisoners was from Vietnam (374 prisoners or 20% of overseas born prisoners) followed by New Zealand (208 prisoners or 11% of overseas born prisoners). (Table 22)
Aboriginal and Torres Strait Islander Prisoners
Aboriginal and Torres Strait Islanders comprised 9% (610 prisoners) of the adult prisoner population. This was the smallest proportion of Aboriginal and Torres Strait Islander prisoners of any state or territory. (Table 14)
The Aboriginal and Torres Strait Islander age standardised imprisonment rate was 12 times more than the non-Indigenous age standardised imprisonment rate (1,683 prisoners per 100,000 Aboriginal and Torres Strait Islander adult population compared to 140 prisoners per 100,000 adult non-Indigenous population). (Table 18)
Legal Status
Unsentenced prisoners comprised 31% (2,223 prisoners) of the adult prisoner population. This proportion has increased from 19% over the past decade. (Tables 14 and 15)
The median time spent on remand by unsentenced prisoners was 2.5 months. (Table 32)
The median aggregate sentence length of sentenced prisoners was 3.5 years. (Table 26)
Document Selection
These documents will be presented in a new window.
 Quality Declaration
  Print Page
 Print All